Case study 04 · Analyse · April 2026 to present
One method, three reports
One method, run twice for a professional services client, from a salary benchmark to a market study across eight software roles.
8 roles
Software roles benchmarked
Stack: Claude · Excel · Google Forms · LinkedIn Recruiter
The problem
The client wanted to know whether its pay held its people. The answer lived in a thin, referral-driven market that published salary surveys average too broadly to act on. The only reliable source was the people currently doing the jobs, one conversation at a time.
The work came twice in two different shapes. The first engagement was a benchmark: the client gave us its own salary bands, and the question was where they sat against the market. The second, three months later, was a candidate market study across eight software roles. It asked what people are actually paid, what the pay comes with, and whether the client’s retention holds up for Sri Lankan candidates.
A method that only answers one of those questions is a project. I wanted one that could answer both.
What I found when I did the work manually
The existing workflow was manual. Consultants took notes during calls, opened LinkedIn profiles one by one and shared them around. Each engagement effectively started from scratch.
Doing it that way showed me three things the numbers alone would not have.
- Titles do not describe jobs. Two people called Technical Lead can be doing work a full level apart. A salary band grouped by title averages two different jobs and describes neither.
- Not every figure a candidate gives is equally reliable. At junior levels, bonus answers were vague enough that they couldn’t be compared. At senior levels, bonus was specific and decisive. The method had to know which figures to trust at which level.
- The notes were the memory. When they lived in one person’s head or inbox, nothing carried over to the next engagement.
What I built
A pipeline that four interviewers could run without me in the room.
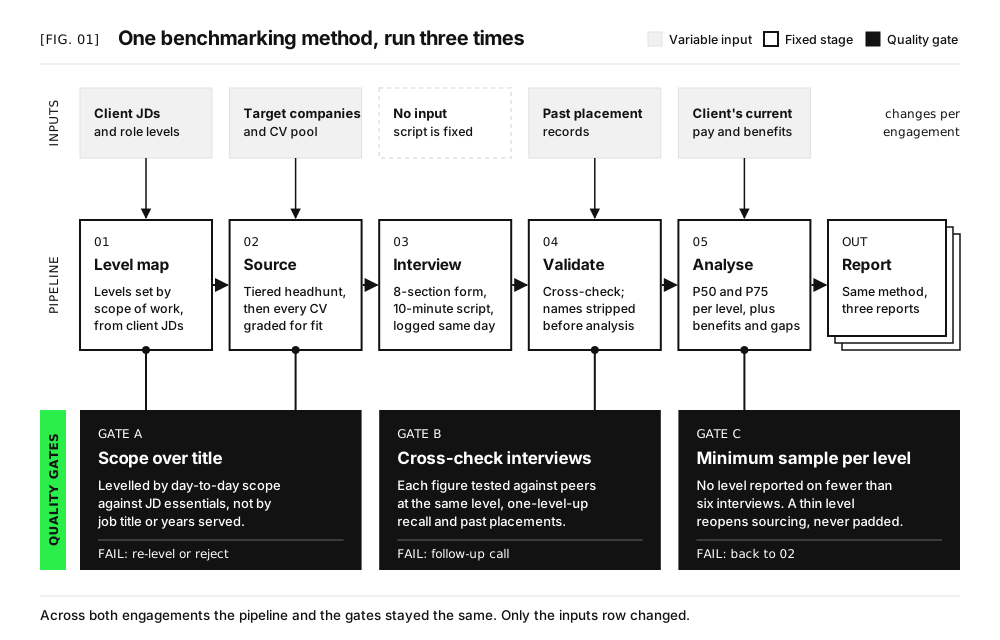
Sourcing. 458 applications were screened against the job descriptions using the recruitment tooling I had already built on Claude. This produced a shortlist of people whose day-to-day work matched the role, not just the title.
Collection. A structured intake form and a ten-minute call script, the same for every interviewer. Branching logic asked senior respondents for their previous salary and skipped it for everyone else. Data went into the form straight after each call, never from memory later.
Storage. Raw responses fed a read-only sheet with names and profile links stripped before any analysis. The analysis tabs were separate and maintained by one person.
Rules written down before the analysis. These are what make the numbers defensible:
- Respondents are classified by scope and reporting line, never by title.
- Anyone not in a salaried, comparable job at the time of the interview is excluded, and the reason is recorded. (6 of 60 were excluded.)
- Three datasets are kept separate and never averaged together: what people are paid (survey), who applied (applicant pool) and who is out there (LinkedIn Recruiter).
- Where the firm’s own judgement goes beyond the data, it is labelled as judgement.
What changed
The second engagement asked a different question from the first, and the method didn’t need rebuilding. It needed new branches.
- Engagement one: 48 structured interviews across eight levels, released in two parts. The senior levels were held back until each had six interviews.
- Engagement two: 60 telephone interviews across eight software roles in three weeks, alongside 458 applications and 22 LinkedIn Recruiter searches.
The second engagement also produced a finding the first method would have missed. For most of the roles, the same title covered two populations at two different prices. That only showed up because respondents were classified by what they actually did. Grouping them by title would have averaged the two populations together and hidden it.
I can’t show the reports. They belong to the client. What I can show is that the same system produced both, and the next engagement starts from the form, the rules and the tracker, not from a blank page.
What I would do differently
The second engagement reused everything the first one had proved: scope-based classification, written inclusion rules, and datasets kept apart. What I rebuilt was the survey, because the question had changed. The first engagement measured the client against the market. The second measured the market itself, across eight roles and three data sources. So the survey grew to match.
Fieldwork showed me where the limit was. The survey worked on paper, but on a live call it was a lot for an interviewer to get through, and length is a cost the interviewer pays in accuracy. The next version is shorter, and the important questions are asked twice in different words, so when two answers disagree I know which figures to trust.
I’d expect to rebuild it again for the next client. The rules stay fixed. The survey should be designed around what the client needs to decide.
Next step
If you're hiring for operations and want someone who has built this kind of system, let's talk.